Help Center
This document explains how each tool works, including input formats, backend processing flow, outputs, and troubleshooting notes.
Quick Navigation
Data Browser
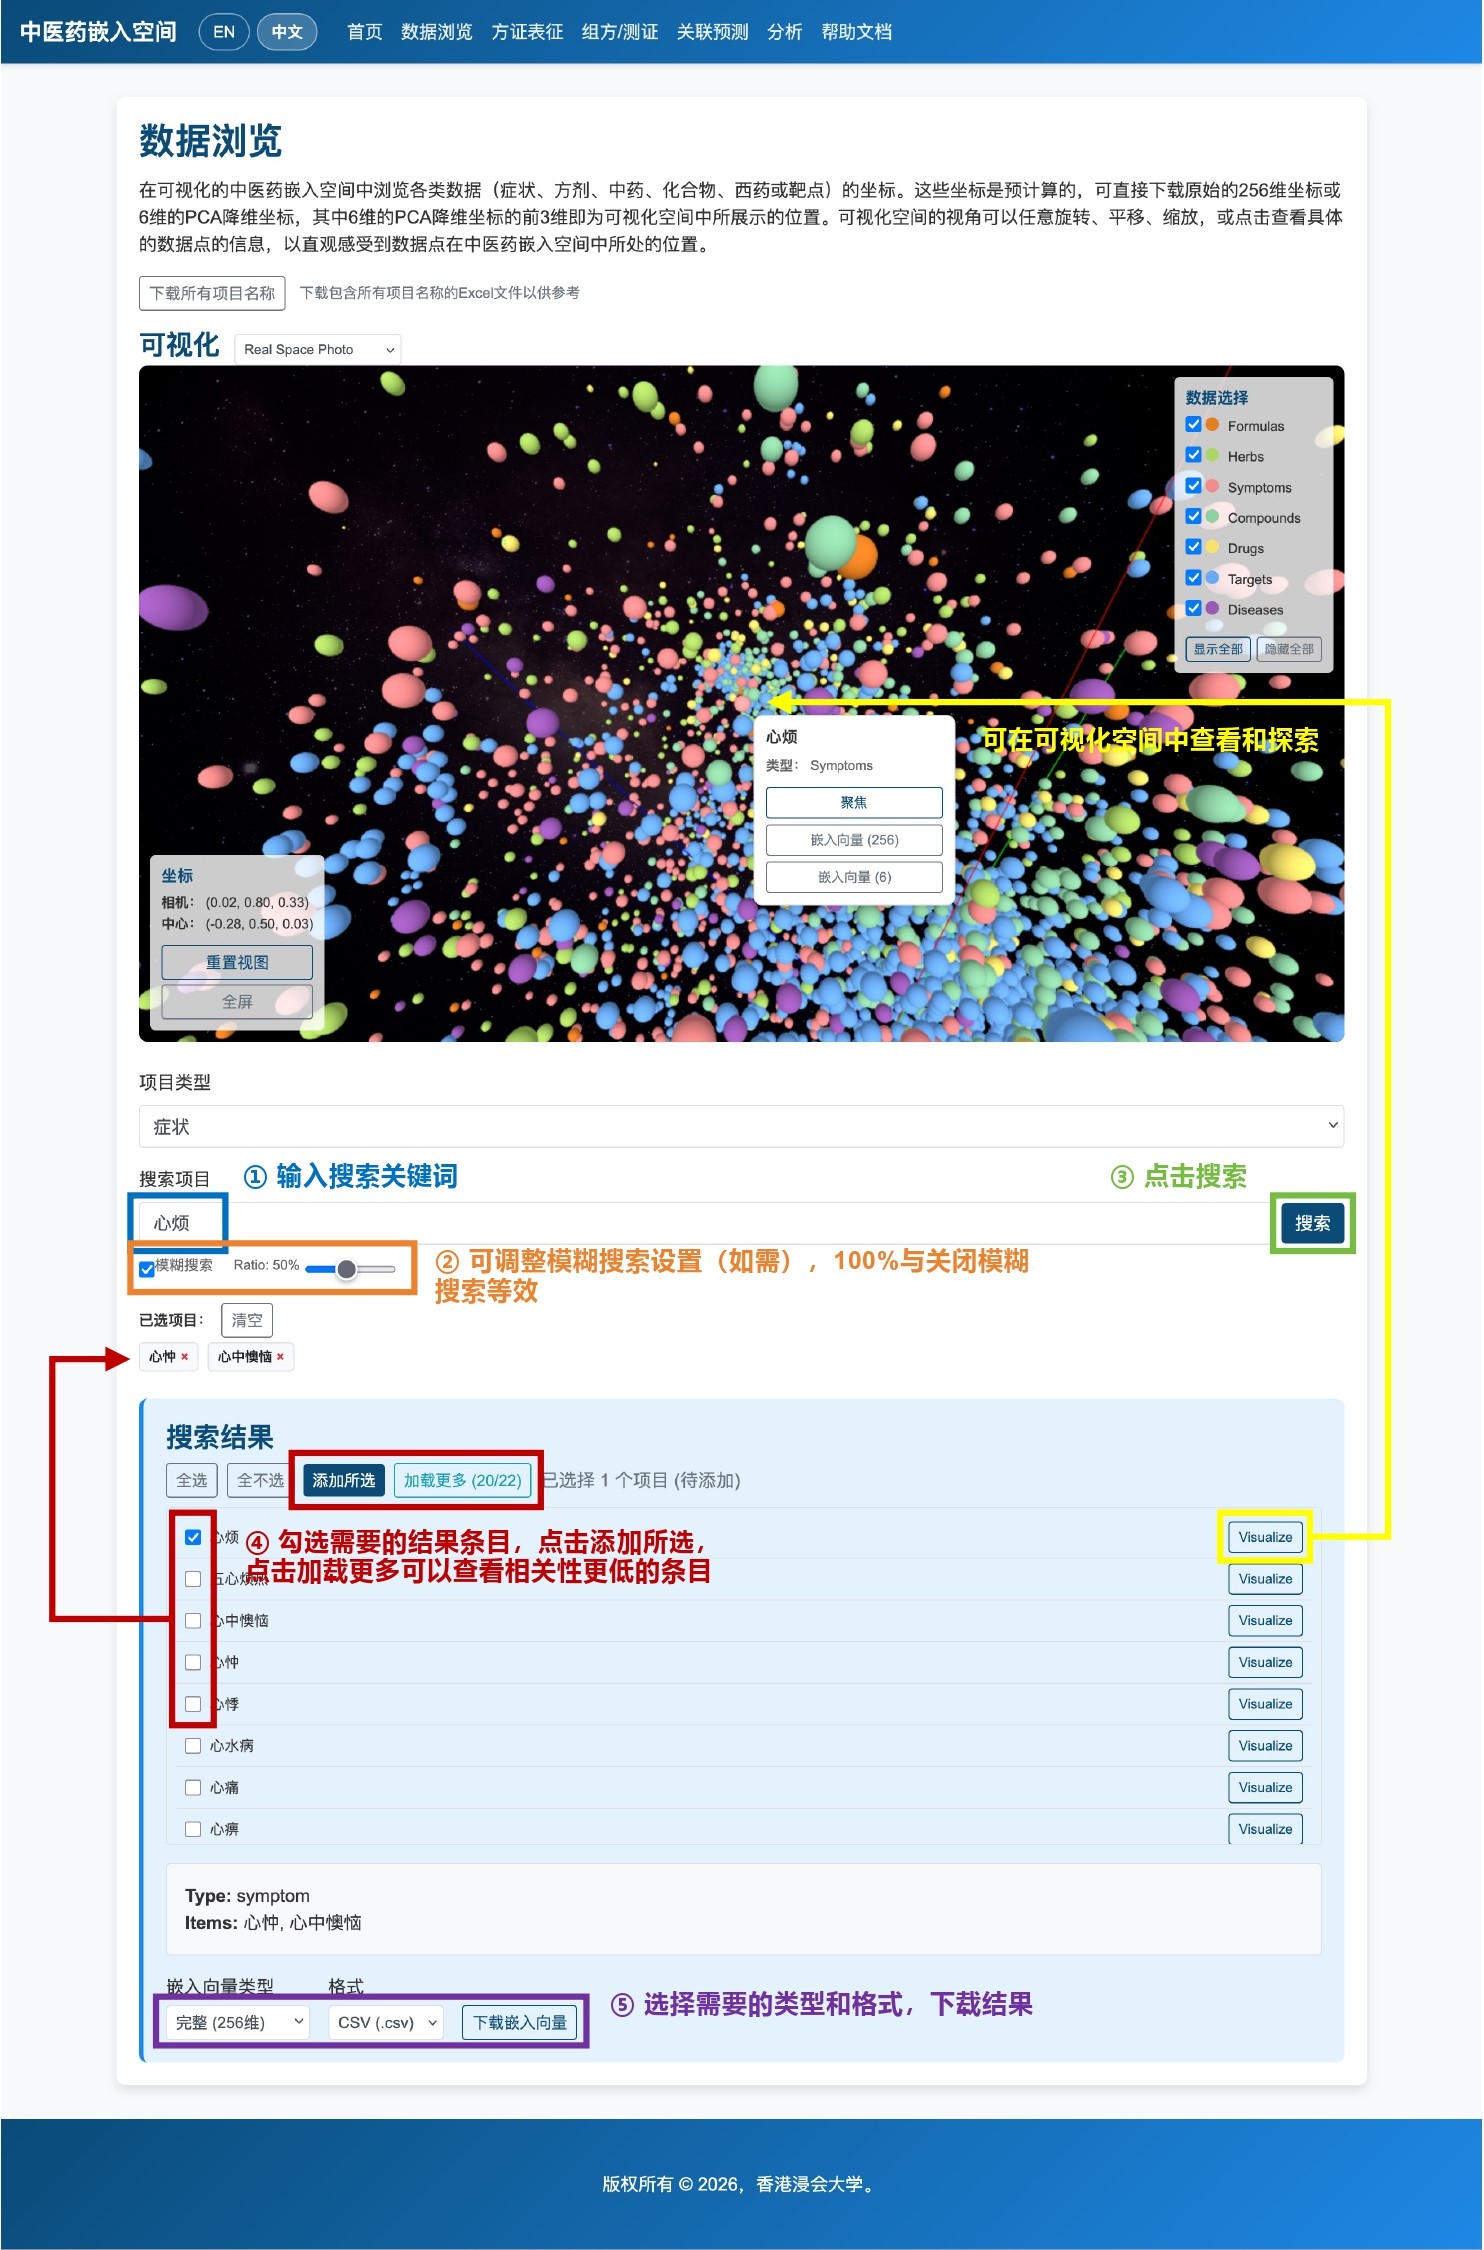
Browse coordinates of various data types (symptoms, formulas, herbs, compounds, drugs, or targets) in a visualized TCM Embedding Space. These coordinates are precomputed and available for direct download as either original 256-dimensional vectors or 6-dimensional PCA-reduced vectors, where the first three PCA dimensions correspond to the positions shown in the visualization. You can freely rotate, pan, and zoom the view, or click points to inspect detailed information, enabling intuitive understanding of where data points lie in the TCM Embedding Space.
- In the visualization space, you can choose which data types to show or hide. Click the focus button on a point's detail card to move the view center to that point.
- In the visualization space, drag with the left mouse button to rotate, drag with the right mouse button to pan, and use the scroll wheel to zoom.
- Reset-view and fullscreen functions are available at the lower-left corner of the visualization space for flexible exploration.
- Fuzzy search can retrieve entries that contain only part of the keyword, and results are ranked by relevance in descending order.
- You can search multiple times within the same type and add selected entries; embeddings for all selected entries will be downloaded at once.
TCM Representation
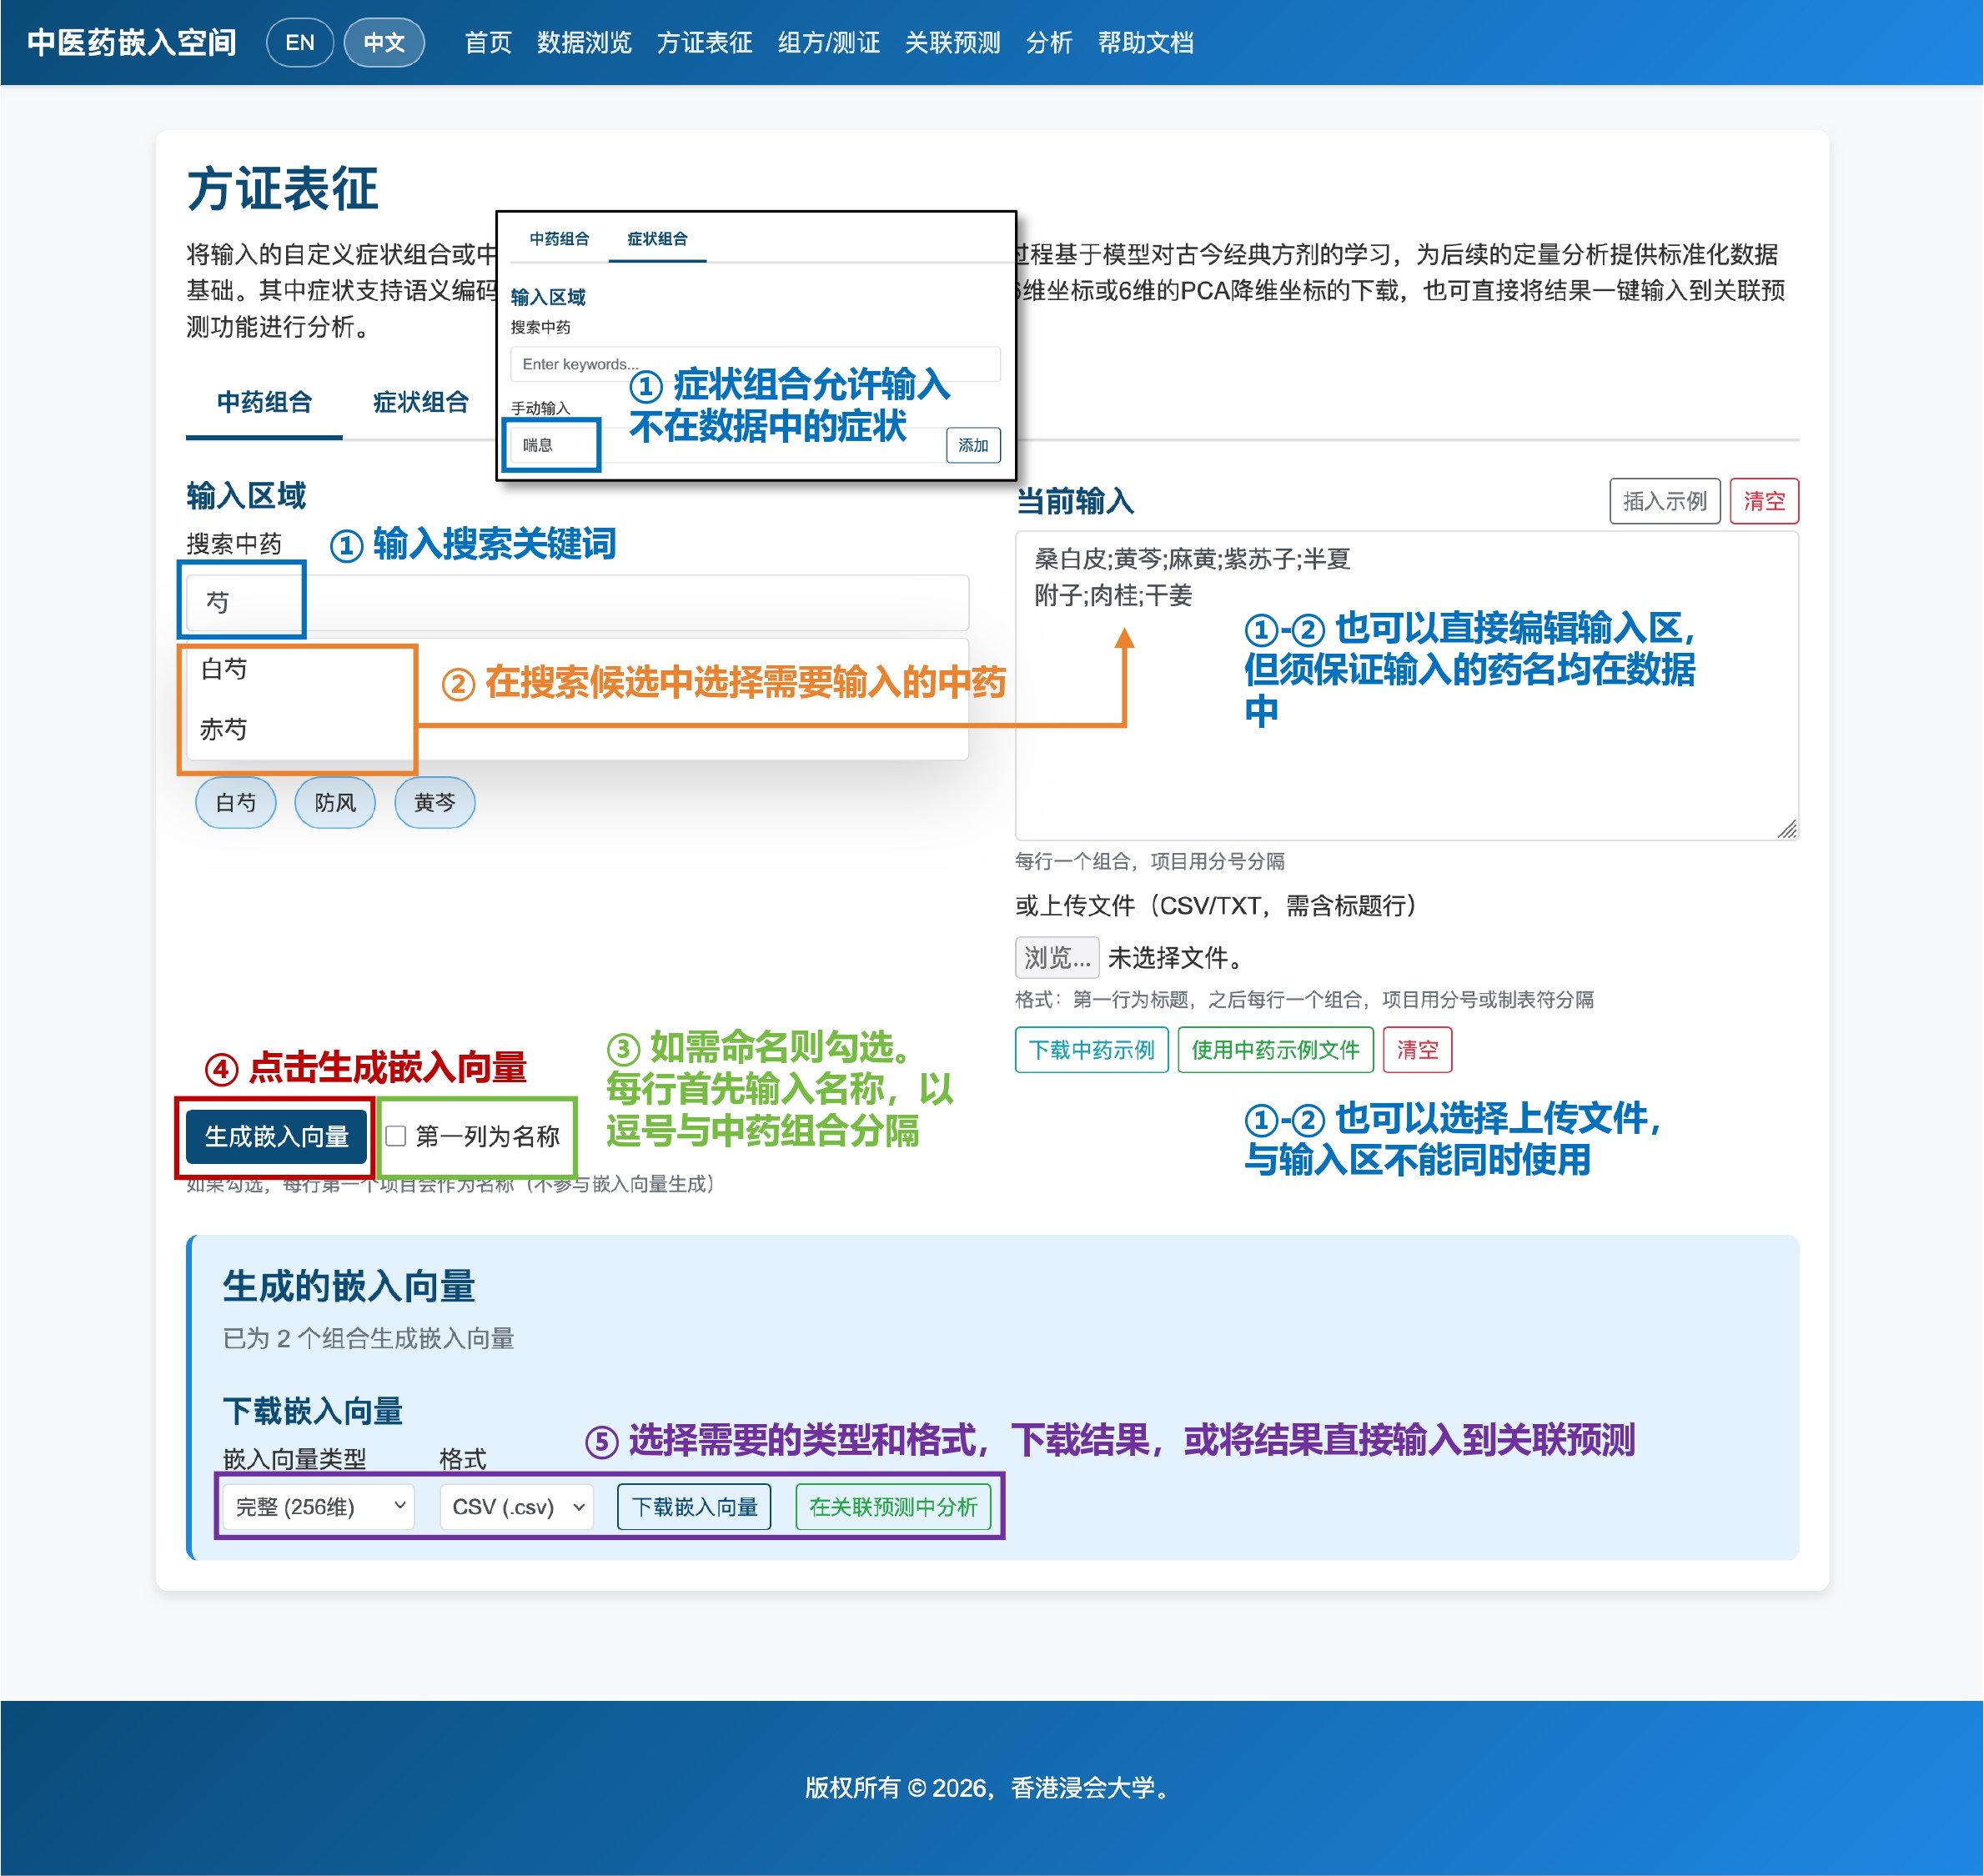
Convert custom symptom patterns or herb combinations into quantitative coordinates in the TCM Embedding Space. This process is grounded in the model's learning from classical and modern formula knowledge, providing standardized data for downstream quantitative analyses. Symptom inputs support semantic encoding, allowing terms not present in the dataset. Downloads are available for both original 256-dimensional coordinates and 6-dimensional PCA-reduced coordinates, and results can be sent with one click to Relation Exploration for further analysis.
- When using symptom patterns as input, symptom names not in the dataset are allowed, but it is recommended to enter symptoms one by one as terms rather than phrases or sentences.
- When "First column is name" is checked, separate the name with a comma. Example: "Custom Formula 2,附子;肉桂;干姜".
- If "First column is name" is not checked, the system will automatically assign names in order in the result file.
- Page input and file upload cannot be used at the same time. To switch methods, please clear the current input first.
Generation
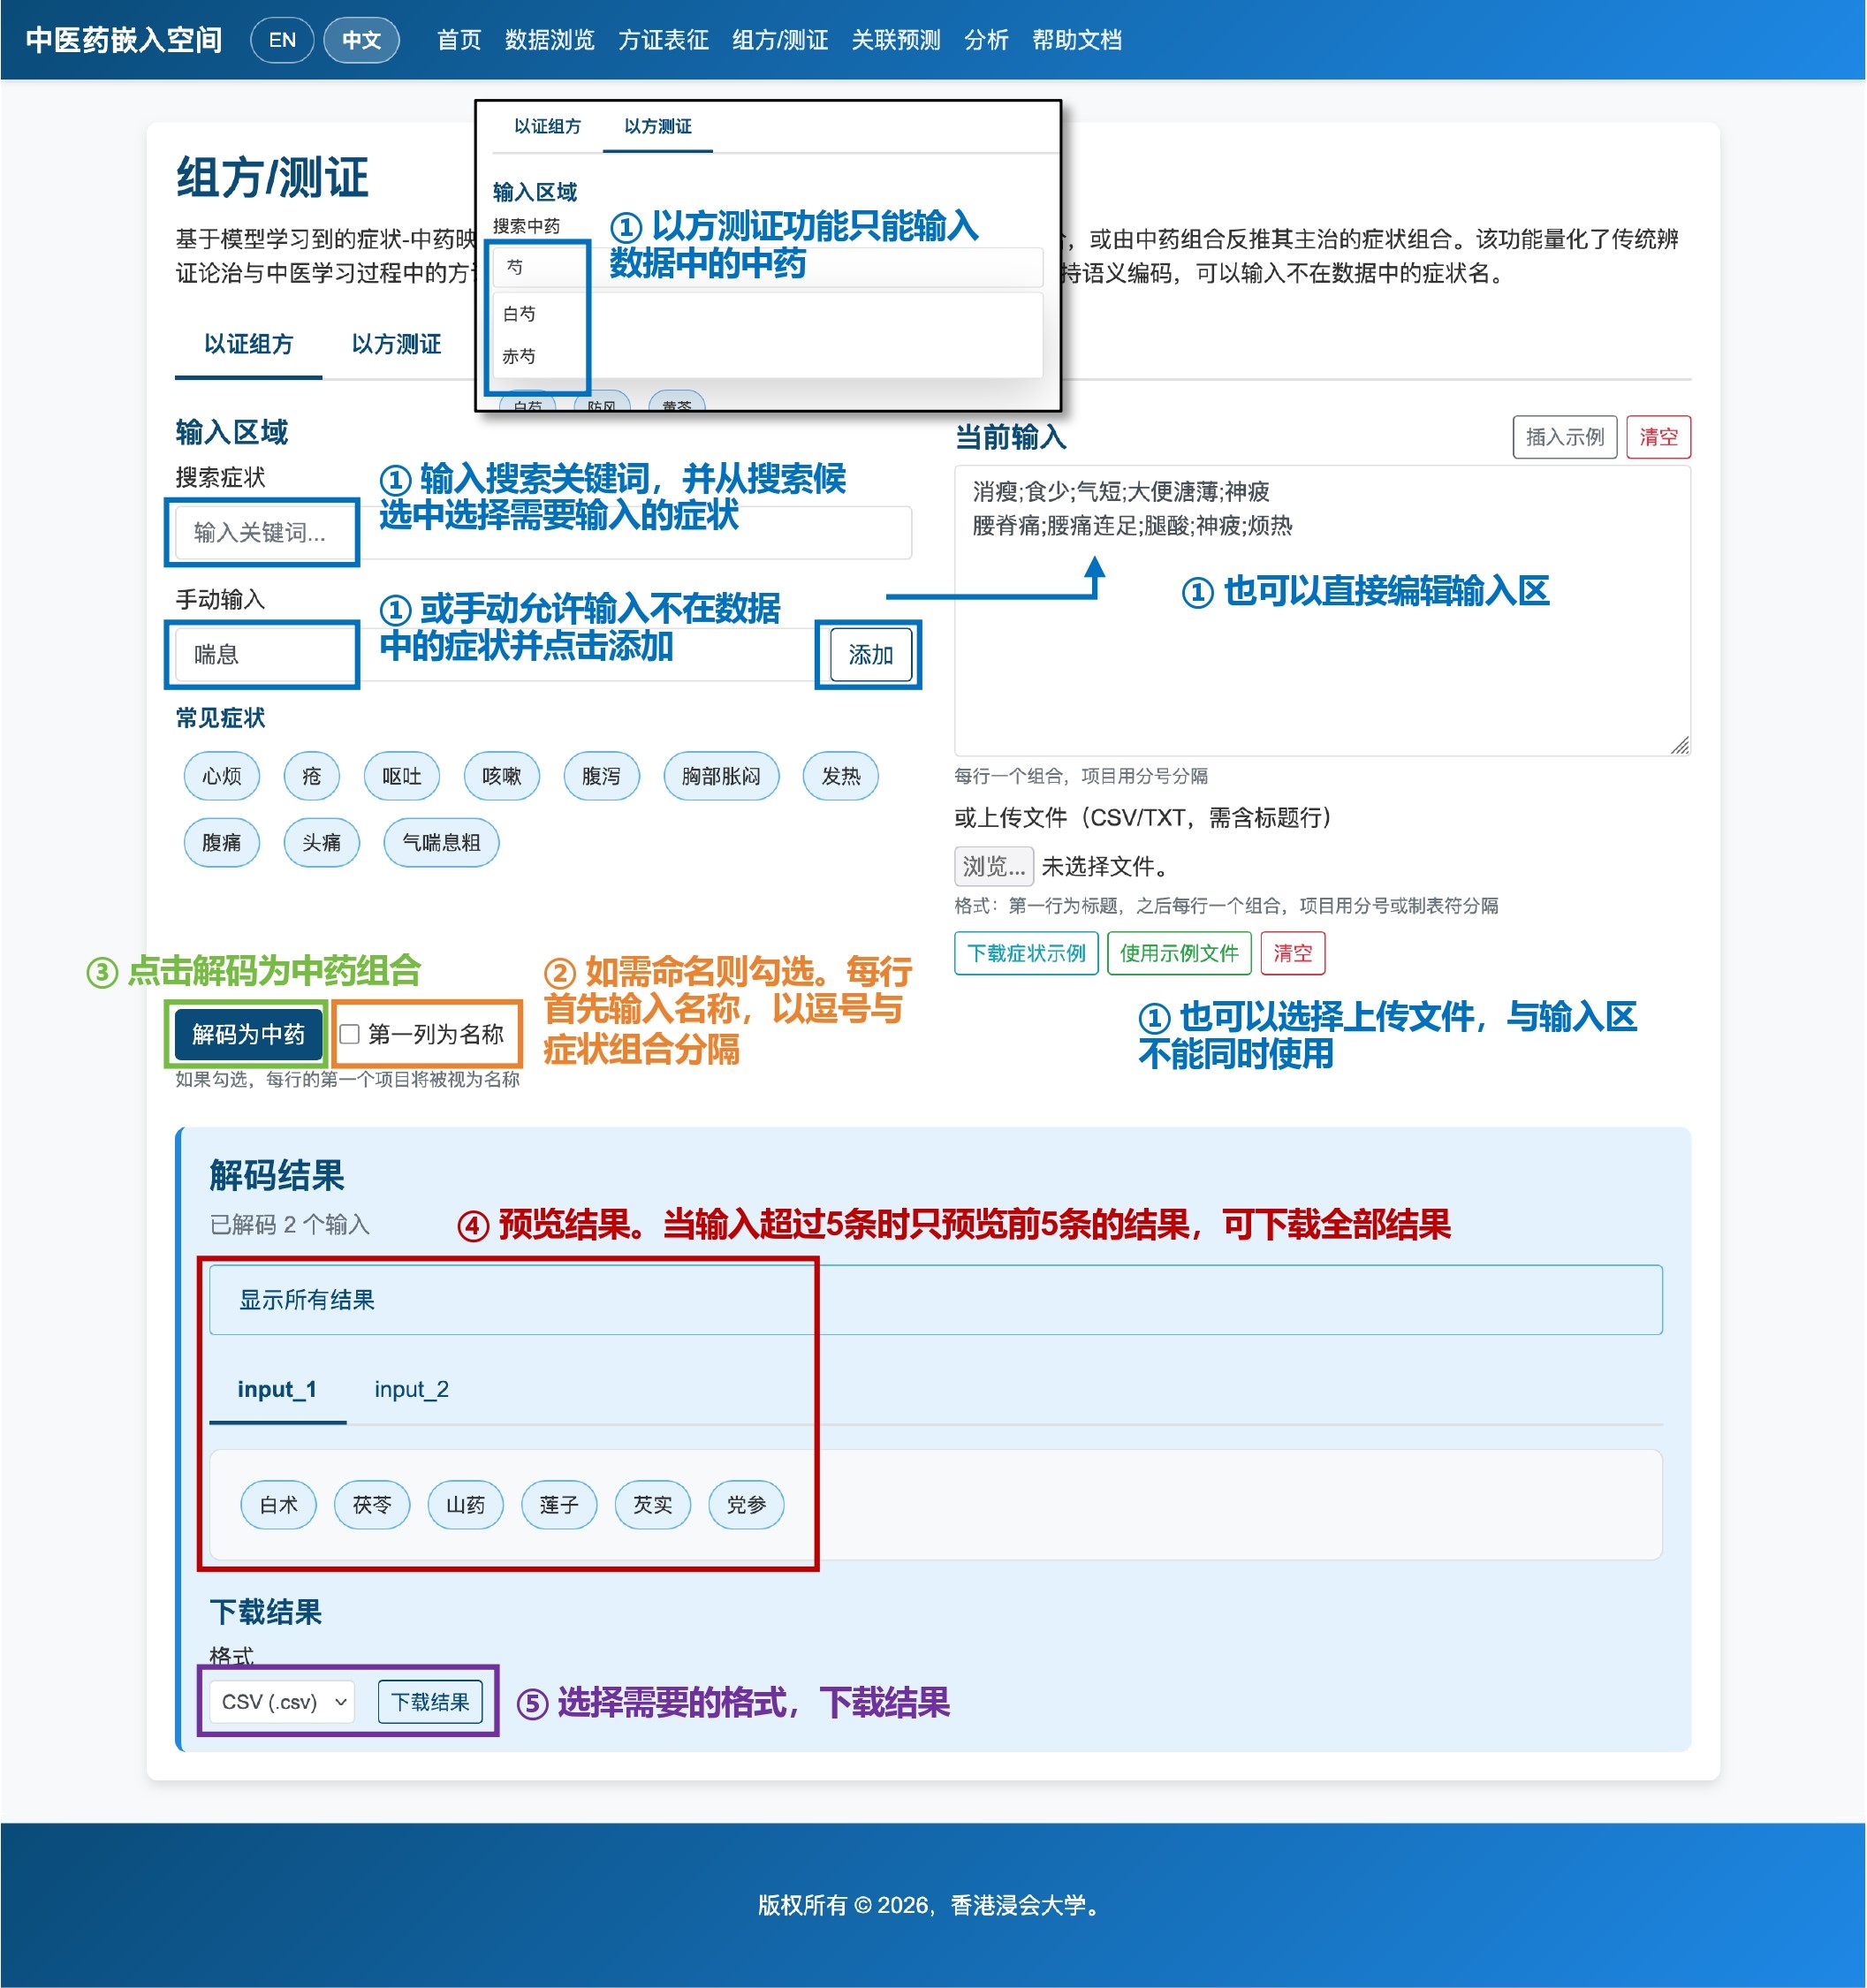
Based on symptom-herb mapping patterns learned by the model, this tool infers recommended herb combinations from input symptom patterns, or inversely infers the primary symptom patterns from herb combinations. It quantifies the correspondence between formulas and syndromes in traditional pattern differentiation and TCM learning, supporting clinical decision-making, TCM research, and interpretation of formula principles. Symptom inputs support semantic encoding, allowing terms not present in the dataset.
- Input requirements for symptoms and herbs are the same as in TCM Representation.
- Because users may input many symptom patterns or herb combinations at once, the preview shows only the first 5 results by default; the full results can be downloaded.
Relation Exploration
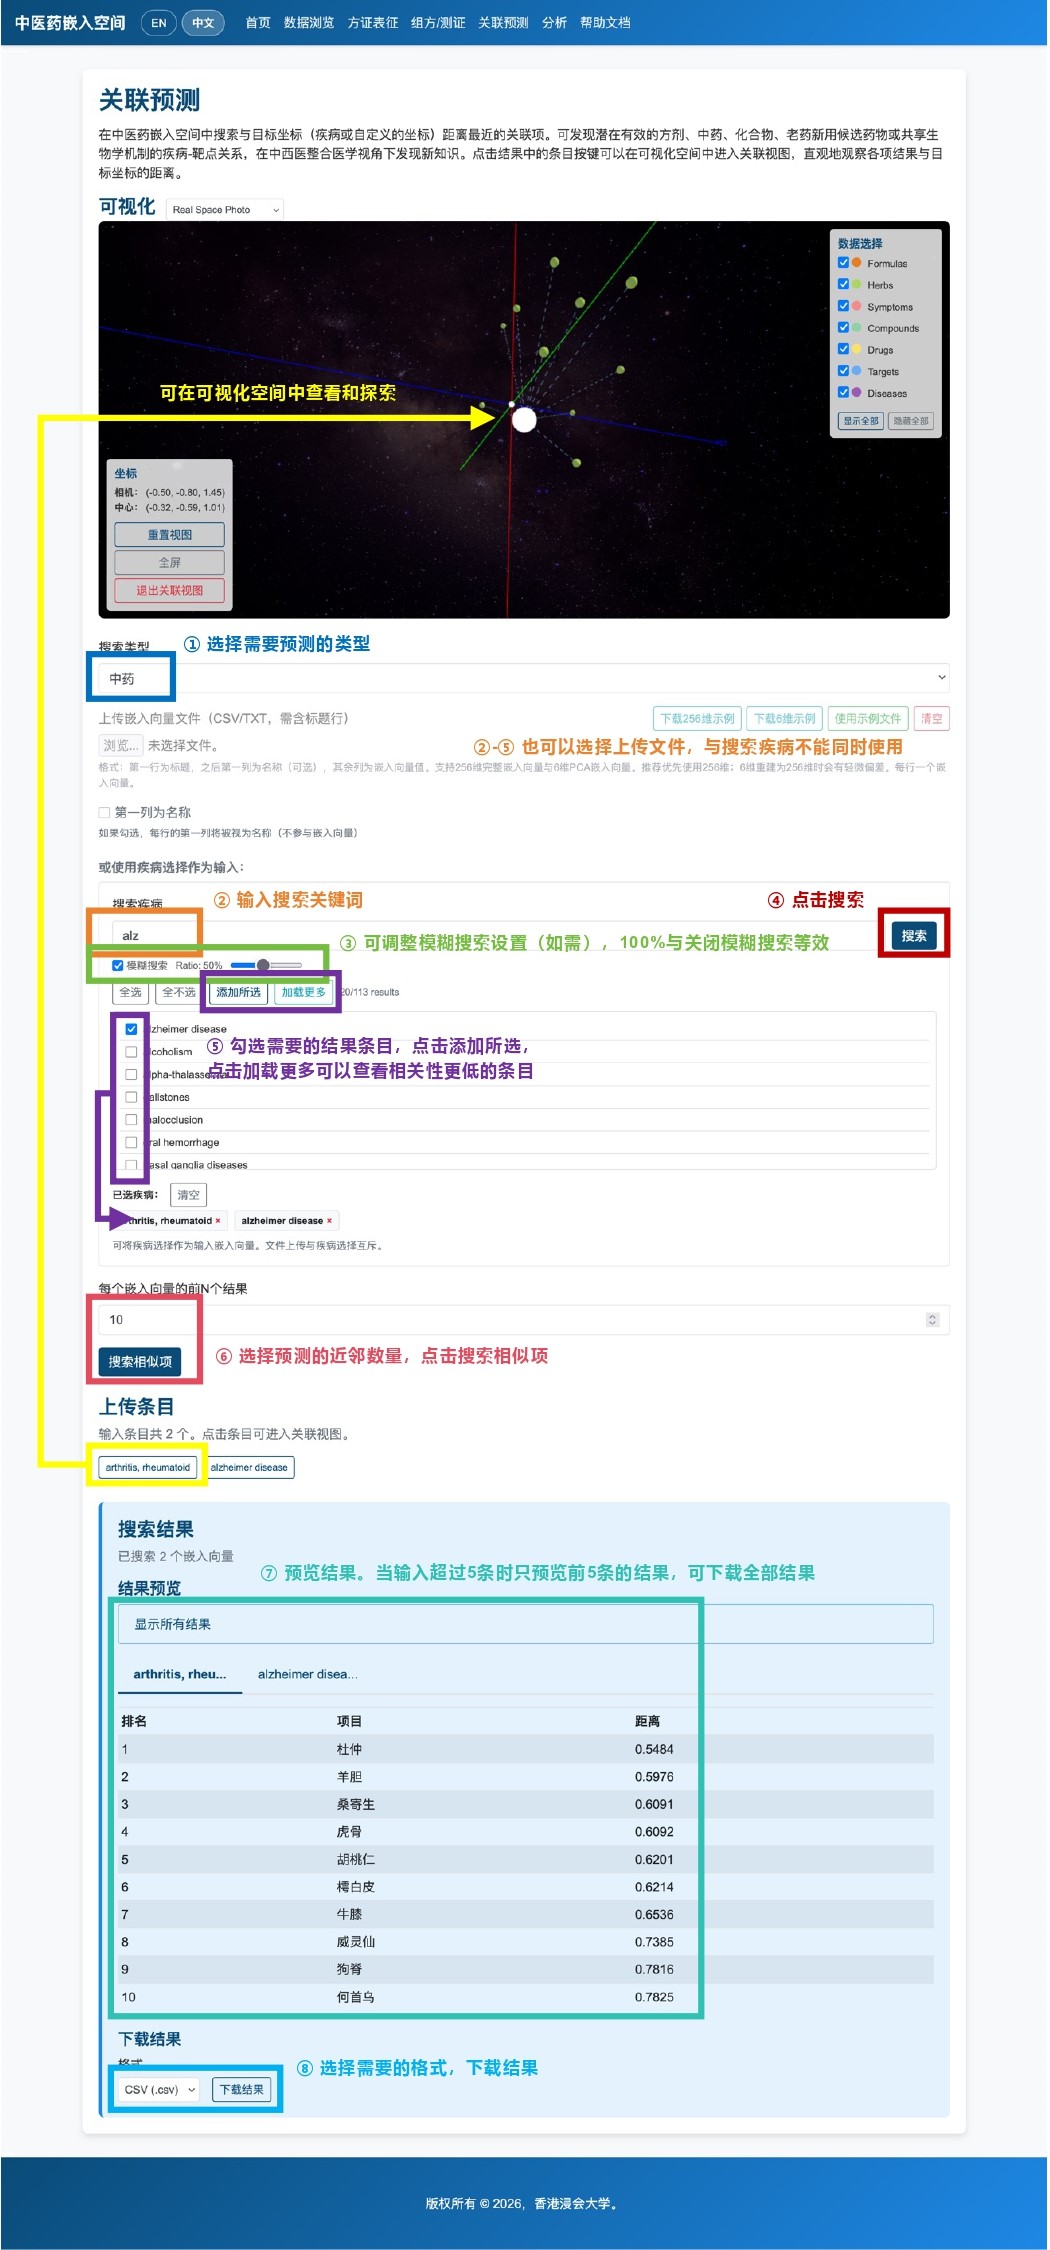
Search related items that are nearest to the input coordinate (a disease or a custom coordinate) within the TCM Embedding Space. This helps identify potentially effective formulas, herbs, compounds, drug-repurposing candidates, or disease-target relationships with shared biological mechanisms, enabling new insights from an integrative Chinese-Western medicine perspective. Click entries in the results to open the association view in the visualization space and intuitively inspect distances to the target coordinate.
- Uploaded files support both 256D and 6D embeddings, but 256D original embeddings are recommended because PCA reduction may introduce slight deviations.
- When "First column is name" is checked, results display user-defined names; otherwise names are assigned automatically in order.
- File upload and disease selection from the page cannot be used at the same time. To switch methods, please clear the current input first.
- Search behavior is the same as in Data Browser.
- By clicking an entry button above the search results, you can enter the association view in the visualization space to inspect explorations near the input coordinate.
- Result preview and download behavior are the same as in Generation.
Analysis
A multi-tab workspace for formula attention, PCA point operations, practice/outcome association/indication statistics, and disease KNN network analysis.
TCM Formula Analysis
Analyze how the model allocates attention when processing herbs contained in a formula and the symptoms the formula treats. Attention is not a direct measure of outcome association strength or causal effect of an herb on a symptom; it reflects which information the model prioritizes during inference. Higher attention indicates the reference value of specific information for understanding the current symptom or herb combination, or for distinguishing it from similar cases. Because reference contexts differ and the attention mechanism is dynamically adjusted for each specific input set, inconsistency between symptom→herb and herb→symptom cross-attention is a normal behavior consistent with model logic.
- A normalization option for the attention matrix is provided and can be used as needed.
- Both the original and normalized attention matrices are downloadable; choose one from the dropdown next to the download button.
3D PCA Visualization
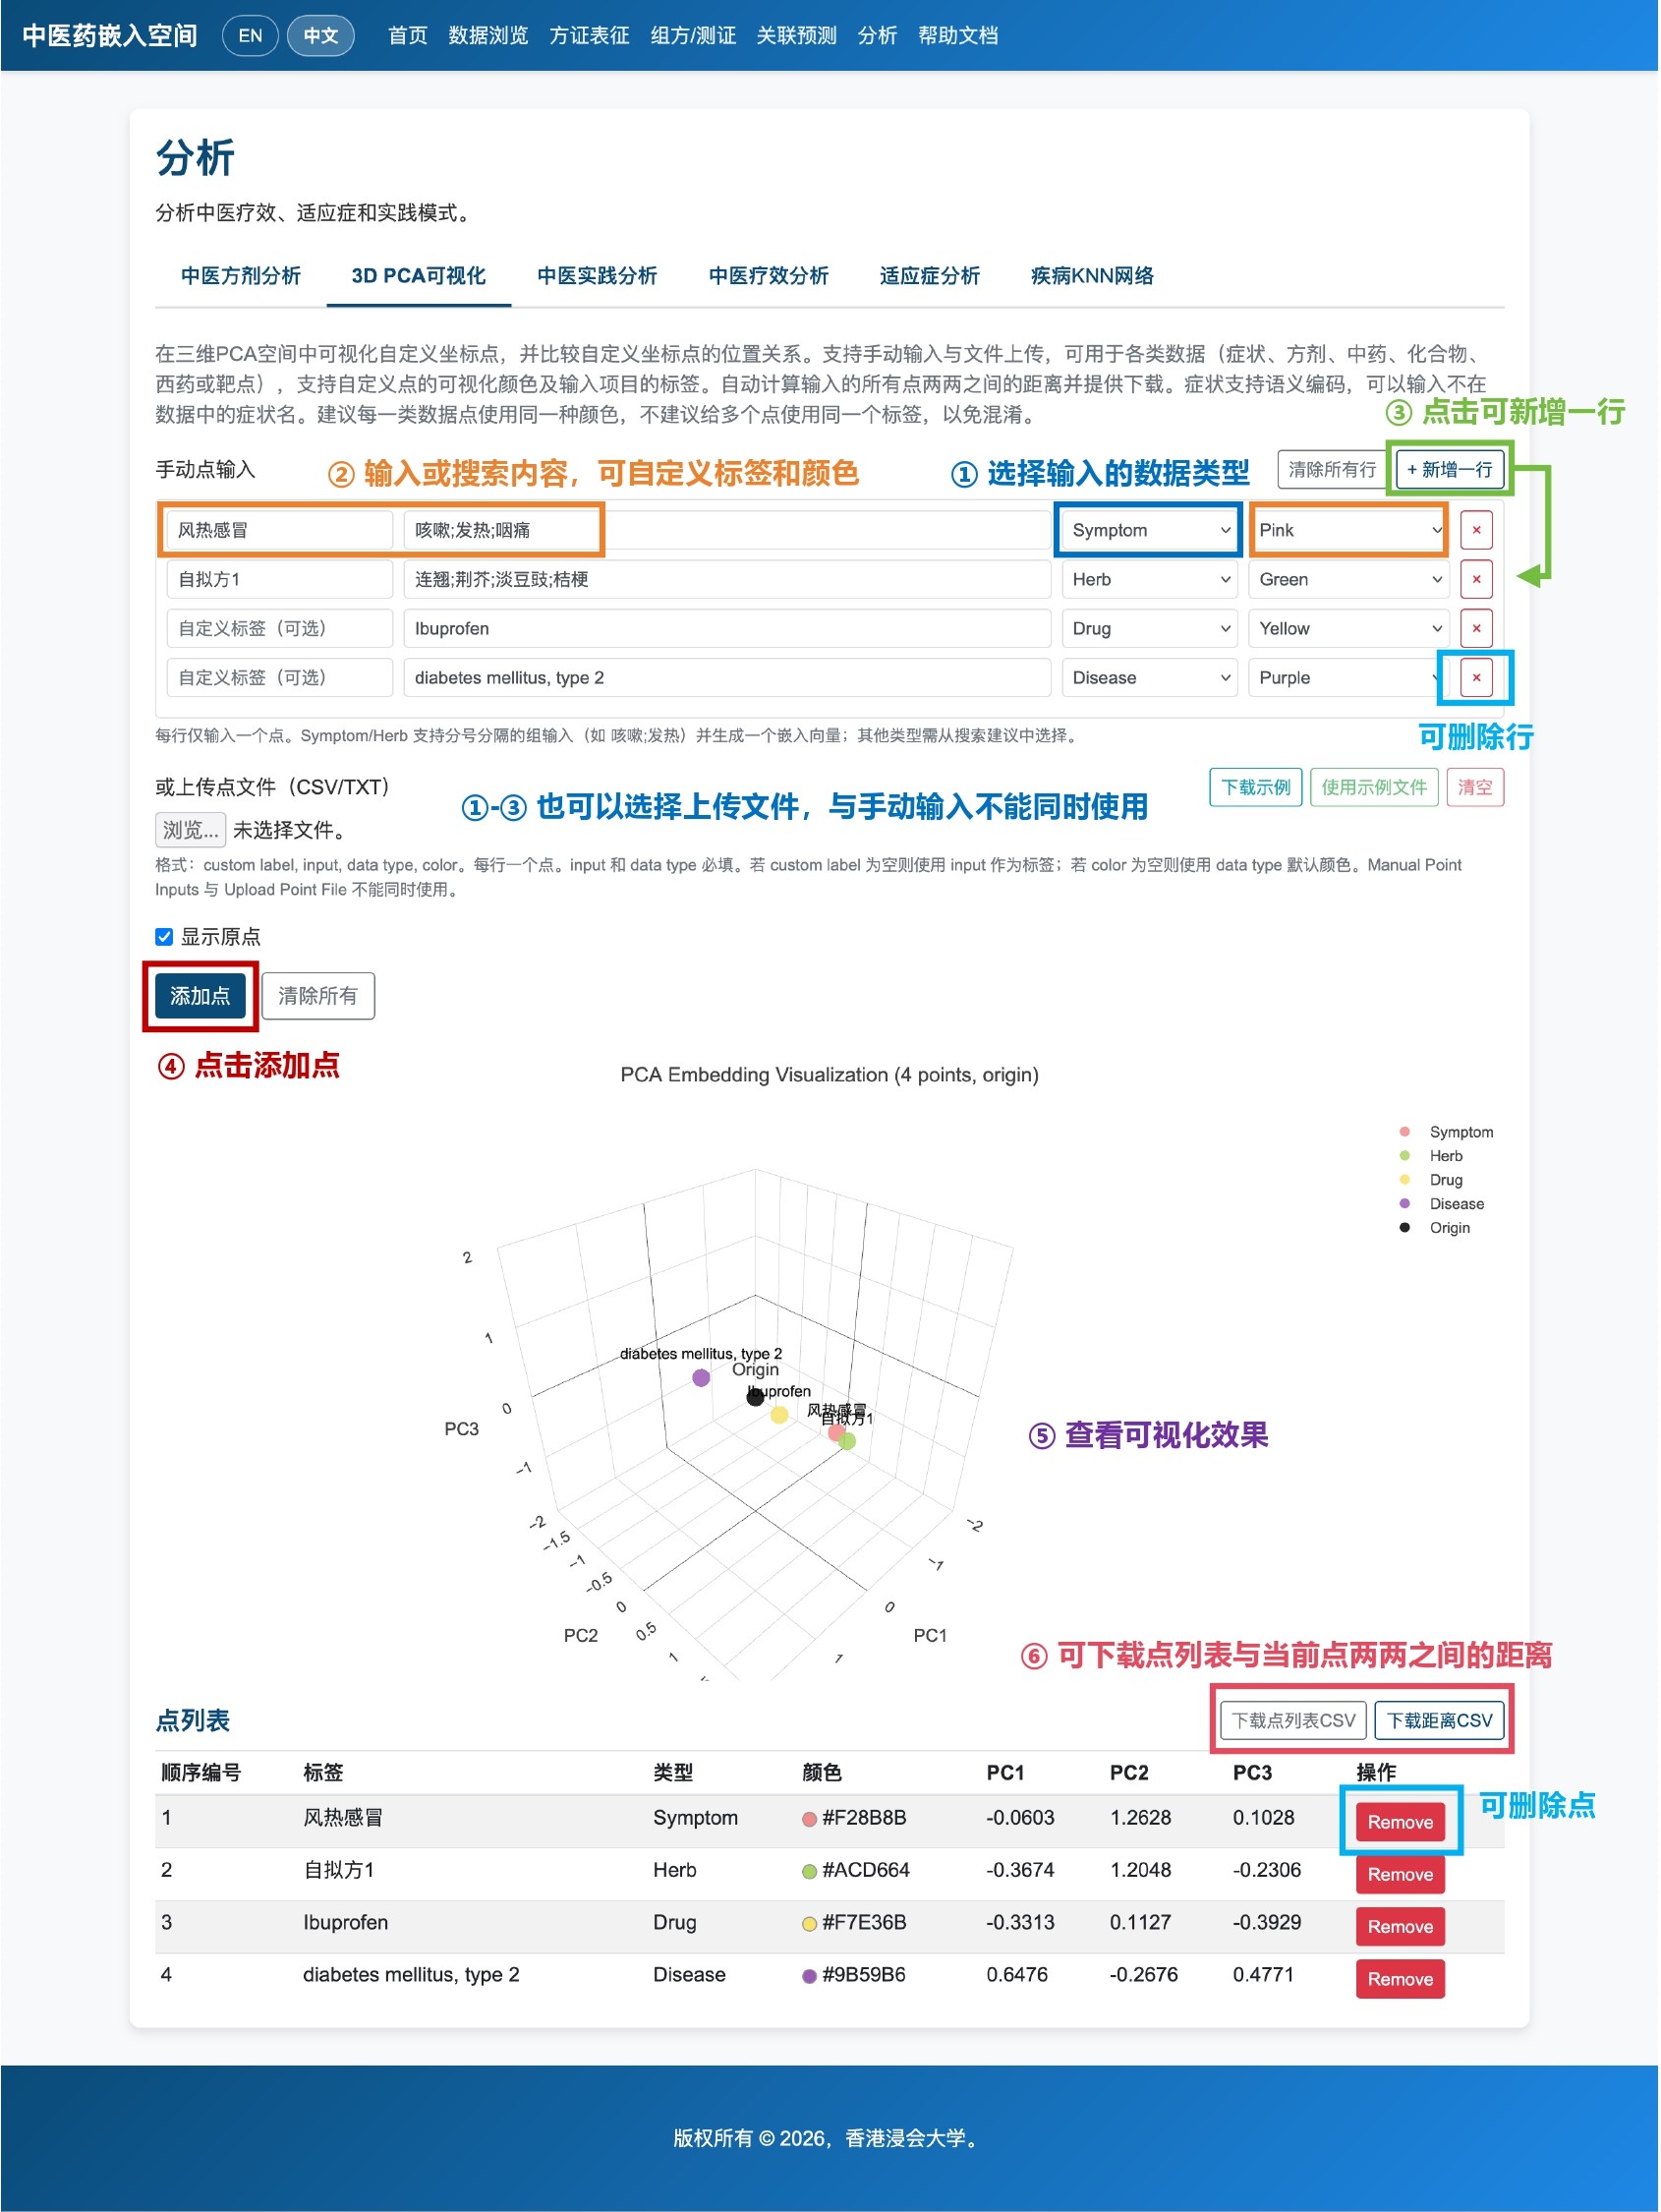
Visualize custom coordinate points in a 3D PCA space and compare their relative positions. Supports both manual input and file upload for multiple data types (symptoms, formulas, herbs, compounds, western drugs, and targets), with customizable point colors and labels for input items. Automatically computes all pairwise distances among input points and provides downloadable results. Symptom inputs support semantic encoding, so symptom names not present in the database can still be entered. It is recommended to use one consistent color per data type and avoid assigning the same label to multiple points to prevent confusion.
- Custom labels are supported for all input types, but using the same label for multiple entries is not recommended to avoid confusion.
- Default point colors are determined by type and can be changed, but using one consistent color per type is recommended to avoid confusion.
- Manual input and file upload cannot be used at the same time. To switch methods, please clear the current input first.
- The system does not automatically detect overlapping points; please check for duplicate additions when adding points.
- You can manually delete individual points in the point list.
TCM Practice Analysis
Based on clinical practice data, this module analyzes the relationship between coordinate distance and co-occurrence strength of symptom sets or herb sets in cases, to assess consistency between real-world clinical practice and the structure of the TCM embedding space. It supports providing symptom patterns and herb combinations in the same file with different counts, and they do not need one-to-one correspondence. Symptom inputs support semantic encoding, so symptom names not present in the database can still be entered. Both scatter plots and error-bar plots are supported; in the error-bar plot, point height is the mean and the upper/lower bar lengths are standard deviations.
- Two co-occurrence metrics are provided for users to choose from.
TCM Outcome Association Analysis
Based on clinical outcome association data of TCM prescriptions, this module analyzes the relationship between outcome association indicators and coordinate distance, to evaluate how well the TCM embedding space explains outcome association variation. Symptom patterns and herb combinations in the data file must correspond one-to-one, along with an outcome association indicator. There are no restrictions on how the outcome association indicator is defined or its value range. Symptom inputs support semantic encoding, so symptom names not present in the database can still be entered. Both scatter plots and error-bar plots are supported; in the error-bar plot, point height is the mean and the upper/lower bar lengths are standard deviations.
- Users can customize the name of the outcome association indicator.
Indication Analysis
Based on herb indication data, this module examines distribution differences in coordinate distances between indication-matched herb–symptom pairs and non-matched pairs. Symptom inputs support semantic encoding, so symptom names not present in the database can still be entered. Supports both box plots and violin plots.
- Users can customize category names.
- To analyze herb indications, only one herb and one symptom are required, but this feature also supports herb combinations and symptom patterns for different user needs.
Disease KNN Network
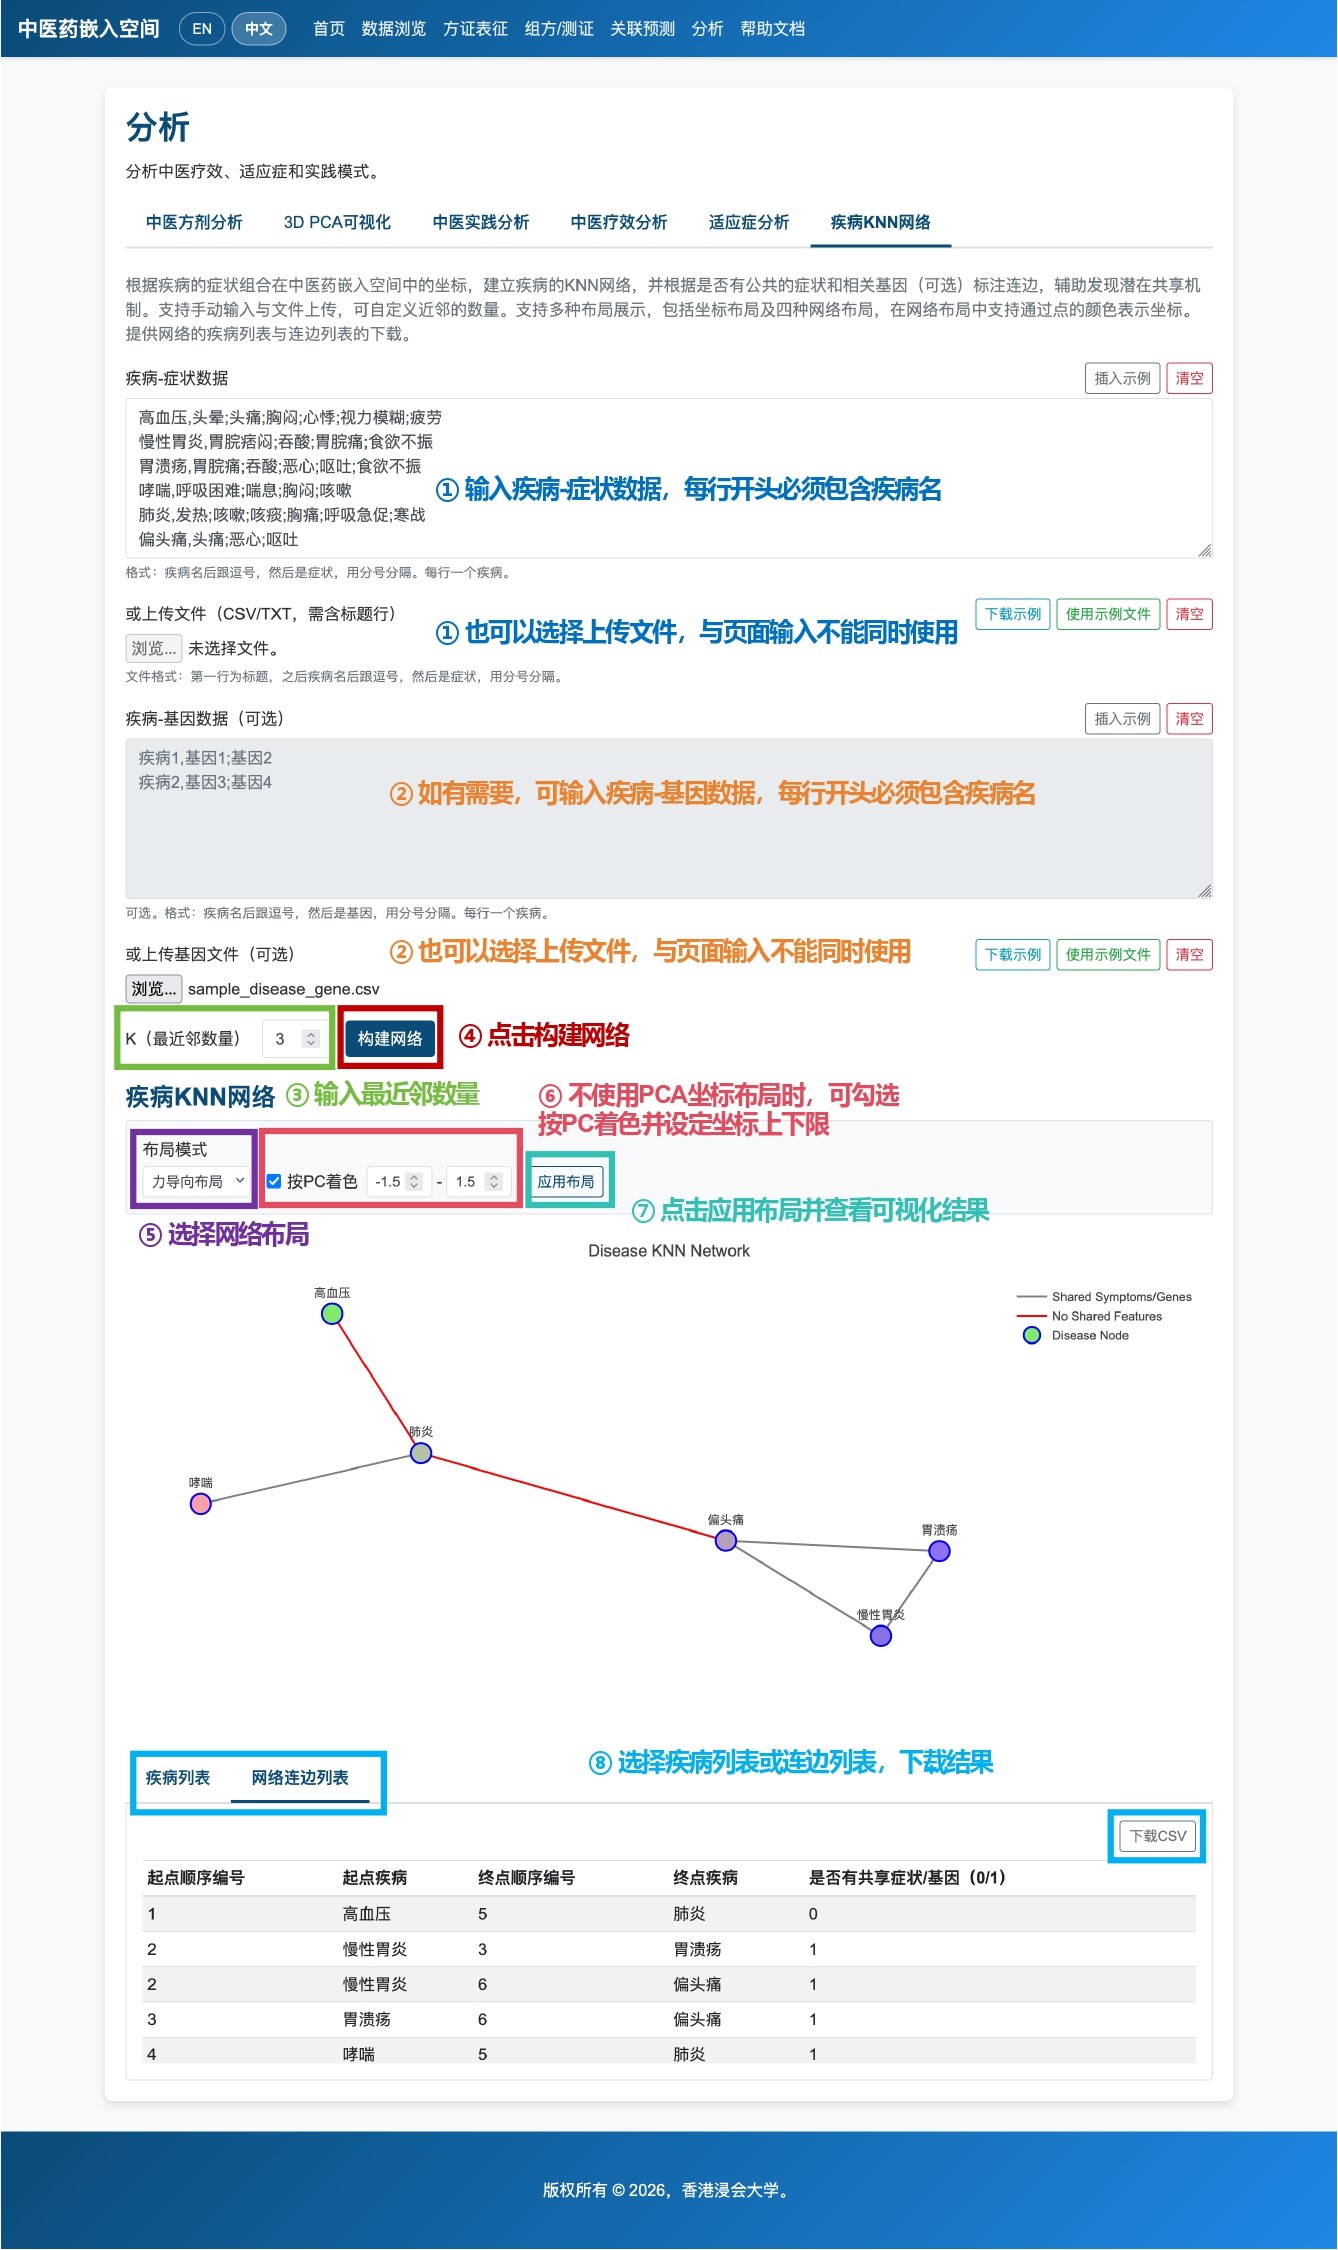
Based on coordinates of disease symptom patterns in the TCM embedding space, this module builds a disease KNN network and annotates edges by whether diseases share symptoms and related genes (optional), helping discover potential shared mechanisms. Supports both manual input and file upload, and allows customization of the number of nearest neighbors. Multiple layouts are supported, including coordinate layout and four network layouts; in network layouts, point colors can represent coordinates. Provides downloads for both the disease list and edge list of the network.
- The network is built so that an edge exists only when two diseases are each within the other's top-k neighbors.
- Page input and file upload cannot be used at the same time. To switch methods, please clear the current input first.
- The meaning of "Color by PC" is a linear mapping between RGB values (0-255) and the user-defined coordinate range: upper bound maps to 255 and lower bound maps to 0. PC1, PC2, and PC3 correspond to B, R, and G values respectively.
- Nearest neighbors in the disease list are not the same as network edges; edges are recorded separately in the edge list.